iMOD Suite
The iMOD Suite provides tools to efficiently build and visualize groundwater models, including unstructured models. Deltares is integrating and improving the iMOD groundwater software. Therefore iMOD is extended with a new iMOD Suite to link to the latest developments on MODFLOW 6 and on the changing requirements in the field of groundwater modelling, most pressing currently the support of unstructured grids.
Furthermore, a second goal of this iMOD Suite was to better connect to the latest developments in the data science ecosystem, by utilizing:
Existing data format conventions (NetCDF, UGRID) instead of developing new ones, allowing more user flexibility to find the right tools for the right job.
Widely used and tested software (QGIS) to which we add a Deltares extension, instead of creating complete programs ourselves.
Modern programming languages (C++ and Python) that allow connecting to a big and lively software ecosystem.
The iMOD Suite offers different modules which support modelling with MODFLOW 6 (including unstructured meshes):
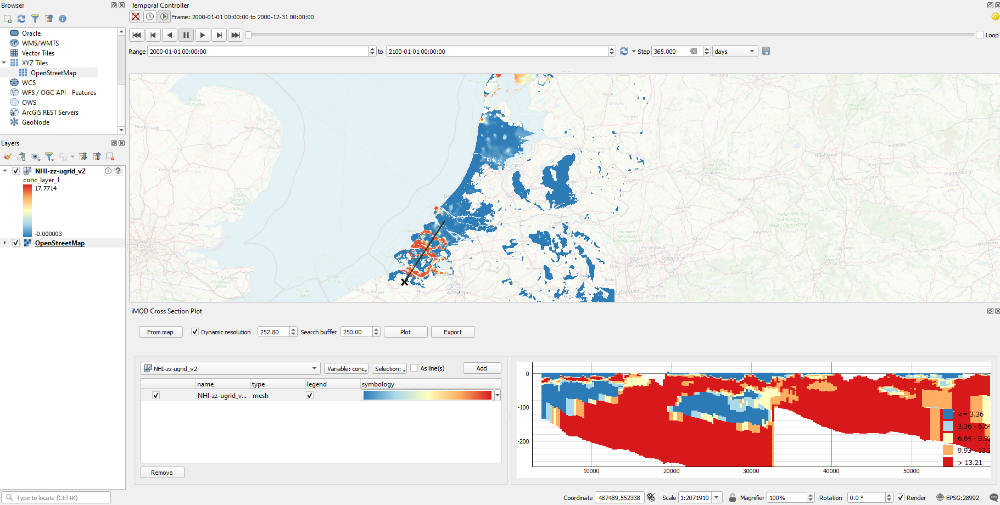
iMOD Viewer (Github page): The iMOD Viewer consist of a standalone 3D viewer and a QGIS plugin.
The iMOD QGIS plugin for visualisation of model input and output data with tools for drawing cross-sections, timeseries and a link to open data in the iMOD 3D viewer. It supports NetCDF files, UGRID and ipf’s.
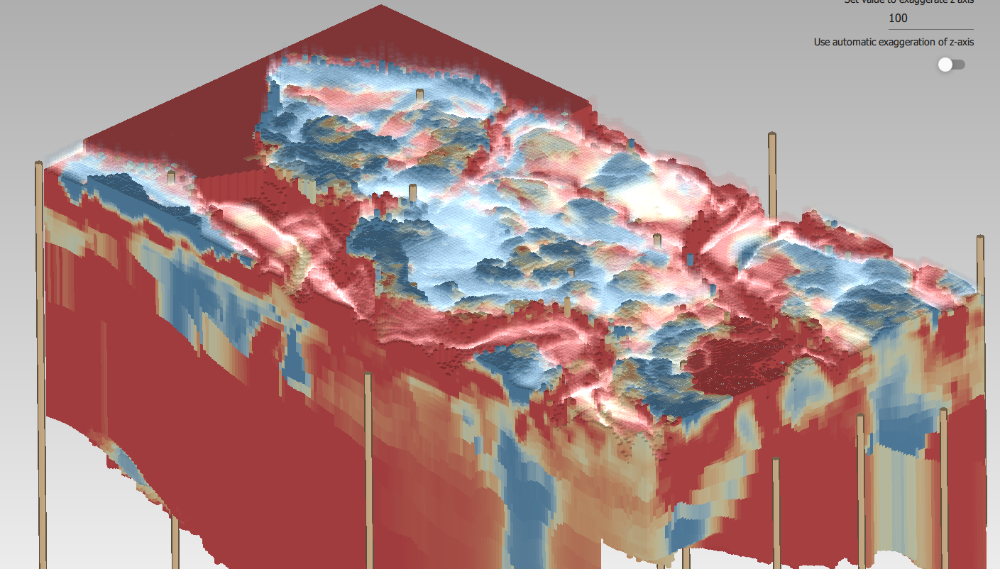
The iMOD 3D Viewer for interactive 3D visualisation of structured and unstructured input and output files. It supports the UGRID file format.iMOD python (Github page). A Python package to support MODFLOW groundwater modeling. It makes it easy to go from your raw data to a fully defined MODFLOW model, with the aim to make this workflow reproducible.
iMOD Coupler (Github page). Additional software (xmipy) to run and update MODFLOW 6 models from Python, which can be used to couple MODFLOW 6 to other computational cores.


